Volume Analysis Module
Introduction
The Volume Analysis Module is designed to estimate the total number of parcels generated based on a customer’s order data. Users can input predefined parcel sizes, such as various parcel bags or box types, to simulate realistic packing scenarios. Once configured, the tool automatically calculates the total parcel count and their cumulative volume.
Beyond basic calculations, the module provides a detailed breakdown of parcel classifications, distinguishing between Single Item Orders (SIO) and Multi Item Orders (MIO). It also flags oversized parcels and includes an automated correction feature for erroneous or missing dimensional data, enhancing the reliability of results. This module is especially valuable for warehouse planning, packaging design, and downstream logistics forecasting.
Running the code

Currently, parcel volume information is hardcoded directly within the Python script. While this allows for quick configuration during development, it limits flexibility for end users. A future enhancement will involve migrating these parcel dimension definitions to the front end of the tool. This would enable users to input or modify parcel sizes, such as small, medium, or large cartons; through a user-friendly interface without editing the codebase. This adjustment will significantly improve usability, adaptability for different customer profiles, and alignment with diverse packaging standards.

At the start of the process, the software prompts the user to optionally apply filters to the dataset. It is highly recommended to filter by date and limit the input to a single day’s worth of data. This is because the module is resource intensive, processing large datasets with multiple dates can result in significantly longer runtimes or even system crashes, depending on the hardware.
Following the filtering step, the tool requests user input to define the relevant column headers in the dataset. These inputs allow the program to correctly interpret the order data and perform volume calculations. The required column identifiers are:
· SKU Column: Unique identifier for each item
· Sales Column (Delivery quantity): Quantity delivered per item (e.g. ‘Delivery quantity’)
· Order Column (Order Number): The customer’s order number
· SKU Length Column: Length of the SKU
· SKU Width Column: Width of the SKU
· SKU Height Column: Height of the SKU
By dynamically collecting these column names from the user, the tool ensures compatibility with a wide range of customer datasets and avoids dependency on hardcoded field names.

The software then prompts the user to decide whether to replace any zero values found within the dimensional columns (Length, Width, Height). These zero values typically represent missing or invalid data, which can significantly distort volume calculations if left unaddressed.
If the user opts to replace the zeros, the software will automatically substitute them with the median values of the respective columns. This approach provides a reasonable approximation without skewing the dataset excessively. Alternatively, the user can choose to retain the zeros, which may be appropriate in cases where only complete and verified records are desired for analysis.
This built in data validation step ensures that the volume calculations remain robust, even when working with imperfect datasets.
Export Files
Once processing is complete, which may take several minutes depending on dataset size and system performance, the software automatically generates a set of visual outputs to aid interpretation.

The primary visualization is a dual bar chart.
· Left Chart: Parcel Count and Percentage:
This chart displays the total number of parcels per parcel size, along with their percentage contribution to the overall parcel count. It clearly shows how demand is distributed across the different parcel dimensions defined by the user. Each bar is split into color-coded segments representing Single Item Orders (SIO) and Multi Item Orders (MIO), enabling a quick visual breakdown of how each size is utilized by order type.
· Right Chart: Parcel Type Distribution by Size:
This chart focuses on the distribution ratio between SIO and MIO for each parcel size. Rather than showing raw counts, it illustrates what proportion of each parcel category is used for single item versus multi item orders. This view is useful for identifying which parcel sizes are more commonly used for consolidated shipments versus individual dispatches.
These visualizations are not only helpful for understanding operational dynamics, but also support packaging strategy, inventory stocking, and automation decisions.
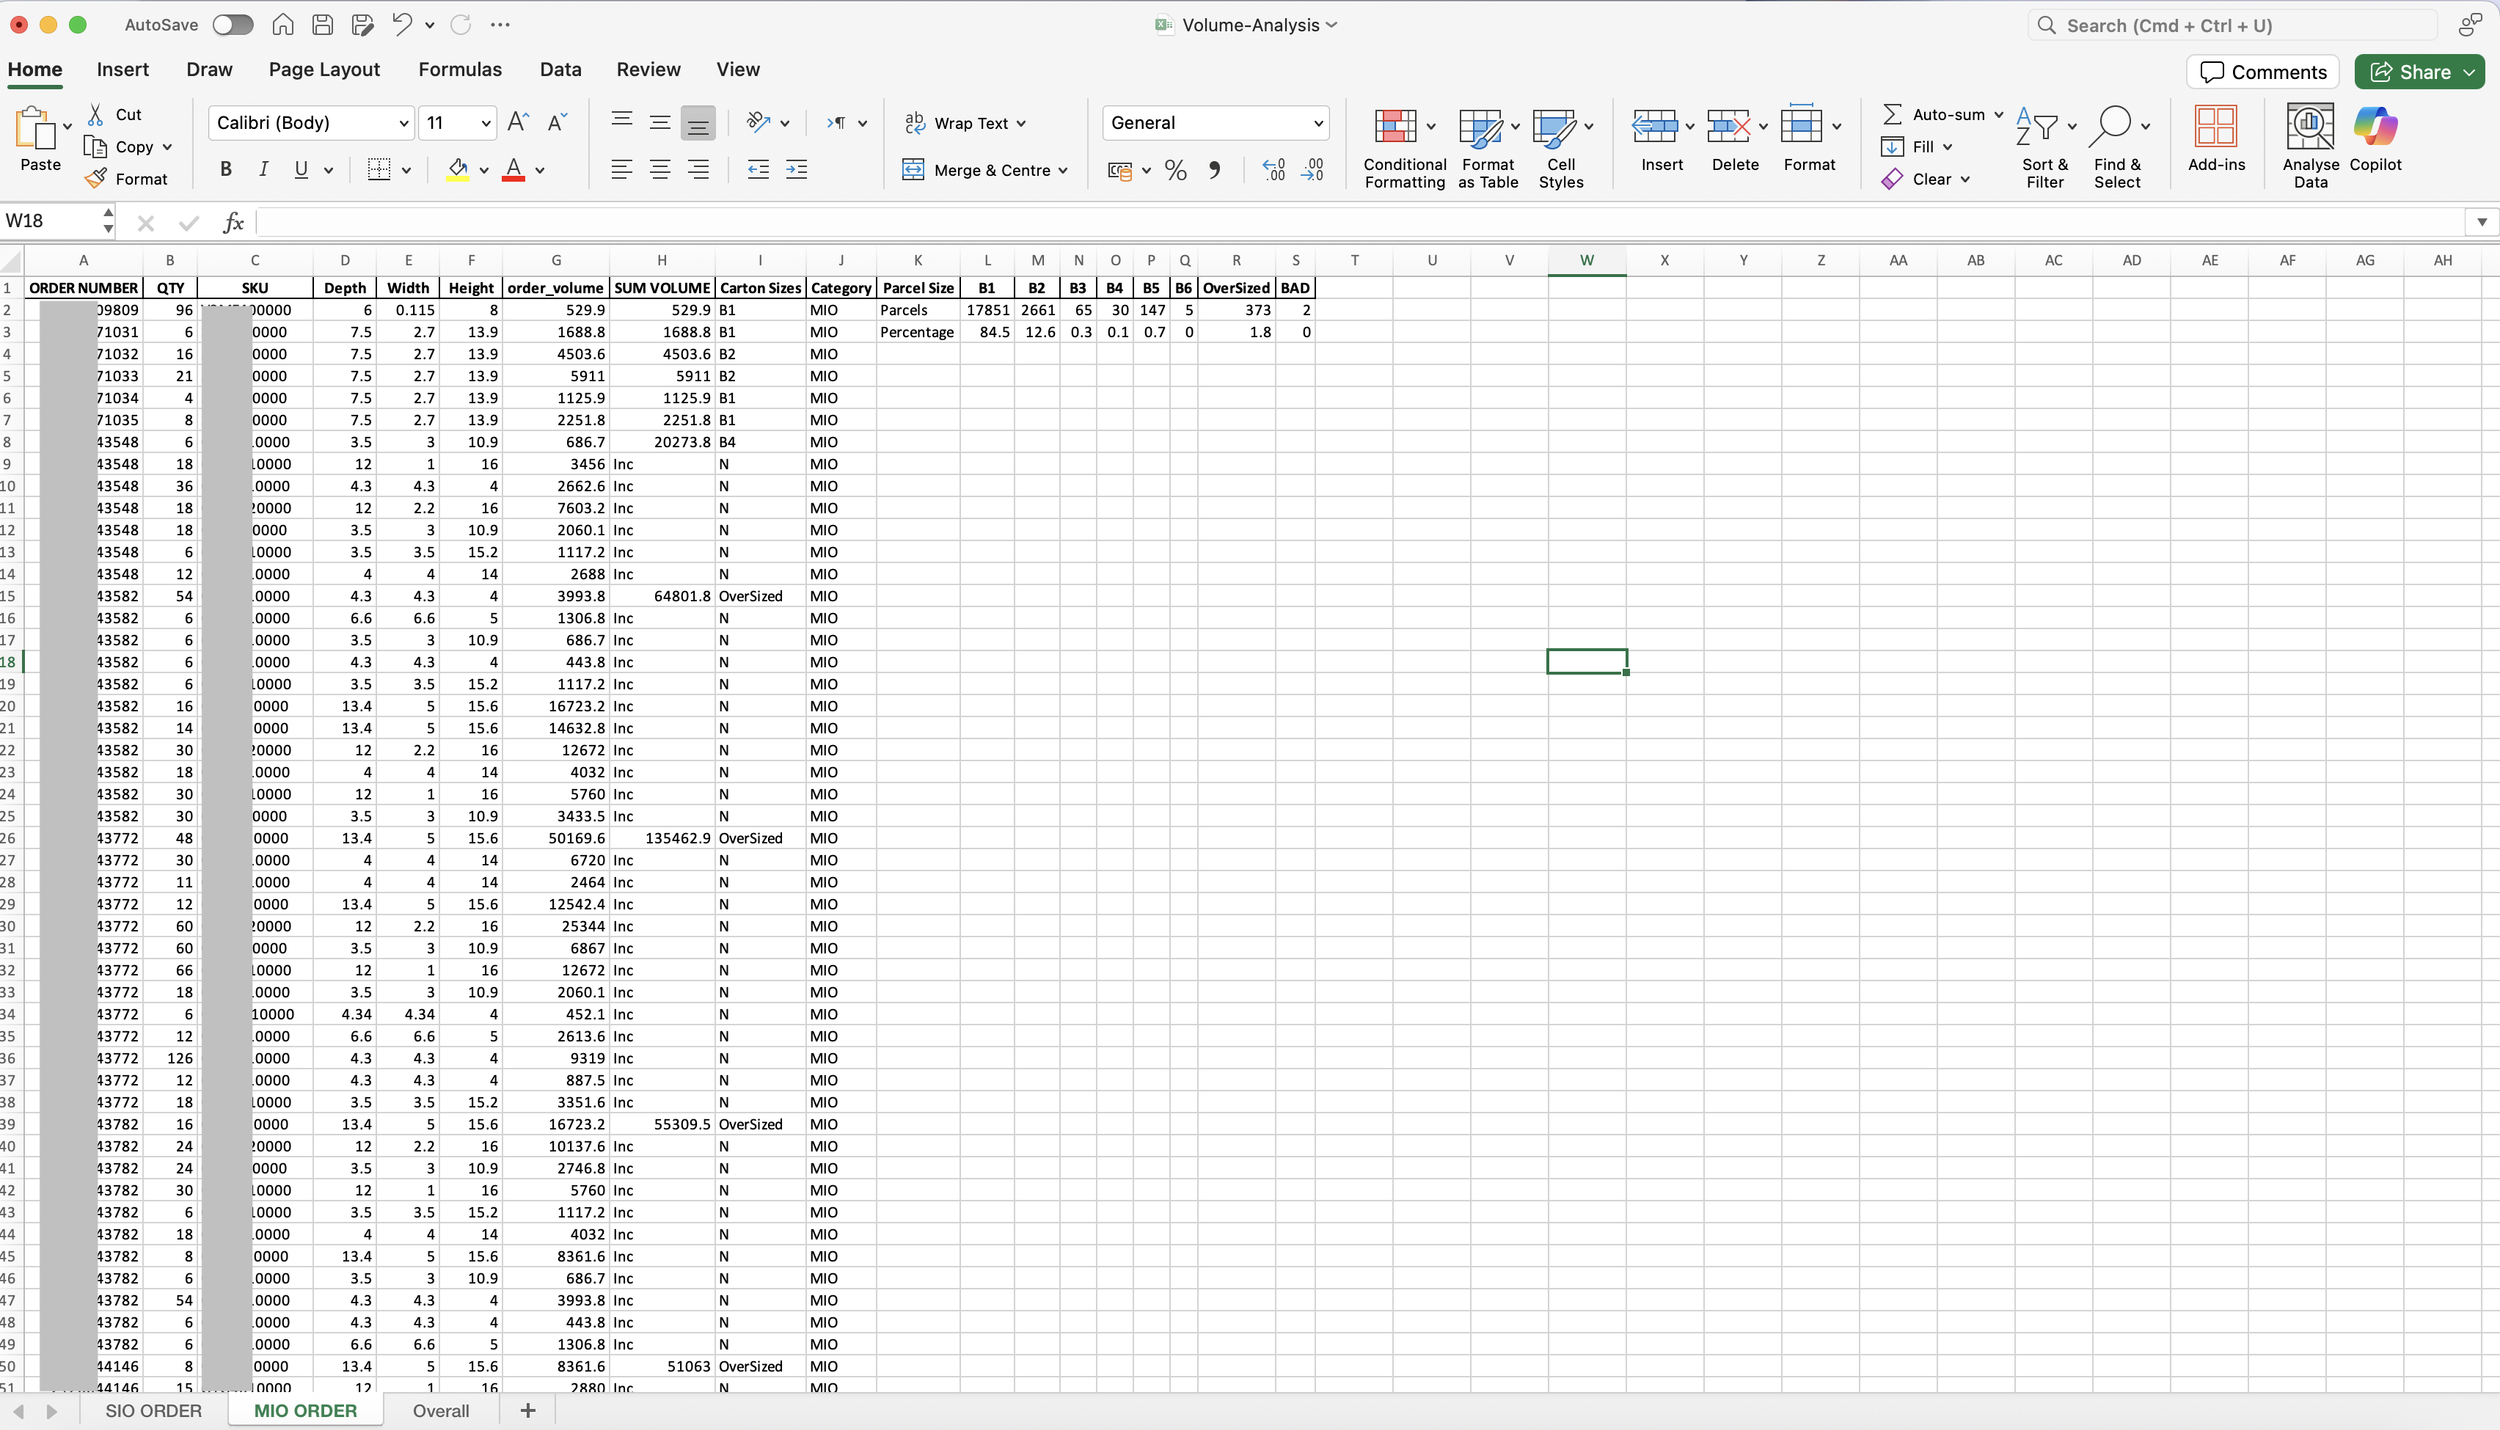
Finally, the tool exports a comprehensive Excel file titled Volume-Analysis.xlsx, which contains a detailed breakdown of the results. This file includes SKU-level data, parcel dimensions, order types, and whether each parcel falls into the SIO (Single Item Order) or MIO (Multi Item Order) category.
The Excel output serves as a valuable resource for further offline analysis. Users can apply custom filters, perform pivot table analysis, or integrate the data into broader warehousing and logistics reports. This output ensures transparency, traceability for reviewing the tool’s parcelization logic and aligning it with operational needs.